Inequality in India can be seen from outer space
Mon 28 May 2018, 15:52:01
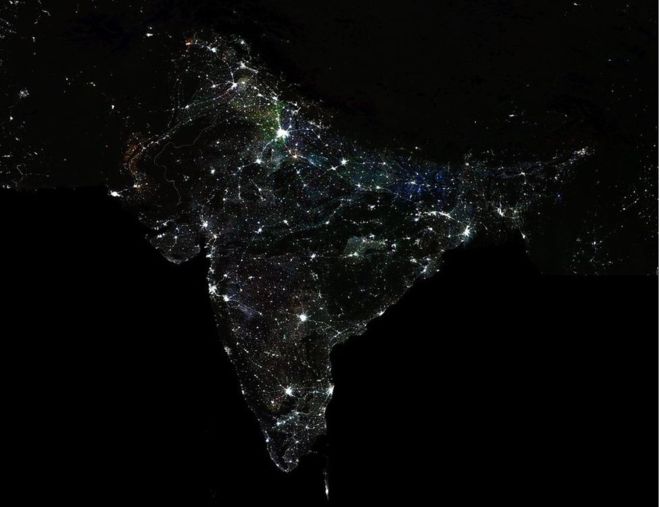
Economists Praveen Chakravarty and Vivek Dehejia certainly believe so. They acquired images grabbed by satellites from the US Air Force Defence Meteorological Satellite Programme. These satellites circle the earth 14 times a day and record lights from the earth's surface at night with sensors. They superimposed a map depicting India's districts on their images, allowing them to develop a unique data set of luminosity values, by district and over time.
Using data generated by the night lights, they studied of 387 of 640 districts in 12 states. These districts account for 85% of India's population and 80% of its GDP. Some 87% of parliamentary seats are in these districts. Using the novel methodology, the economists documented income divergence in India.
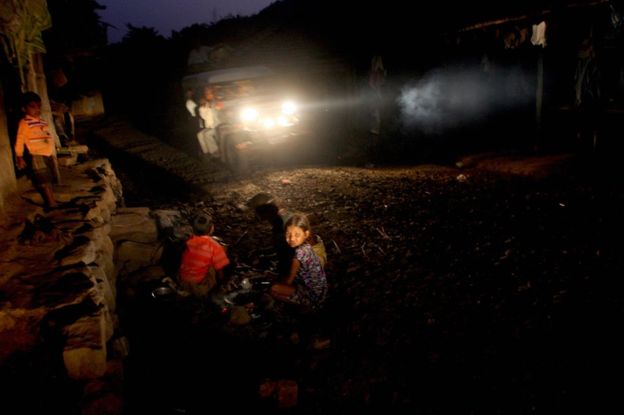
Most of India is dark at night because there is little economic activity going on. But the delicate tracery of lights as seen from space also showed that the states are becoming more unequal between and within them.
Why inequality in India is at its highest level in 92 years
Some 380 districts in 12 states were on average just a fifth as bright as the big cities of Mumbai and Bangalore.
Also, 90% of all the districts are just a third as bright in the night as the top 10% of all districts. And the ratio has worsened between 1992 - a year after India embraced economic reforms - and 2013.
While the pre-1991 years show a modest trend towards convergence of income between different states, the years after show widening divergence. By 2014, the economists found, the average person in the three richest states (Kerala, Tamil Nadu, Maharashtra) was three times as rich as the average person in the three poorest states (Bihar, Uttar Pradesh and Madhya Pradesh).
"What we find is that both across states and across districts with each state, this is a wide, and widening disparity in economic activity. No, it is not that the rich getting richer and the poor getting poorer, but that the poor are not getting richer fast enough to close the gap with the already rich," says Dr Dehejia, a senior fellow at the Mumbai-based think tank IDFC Institute. In other words, less developed states are falling behind the more prosperous states.
"This is a level of regional inequality unprecedented in large federal states in contemporary world economic history."
So why are
disparities within India rising even as standards of living are going up? Some economists believe it could be due to poor governance and lack of adequate skills for jobs in poorer areas. But, in the end, it remains a puzzle.
disparities within India rising even as standards of living are going up? Some economists believe it could be due to poor governance and lack of adequate skills for jobs in poorer areas. But, in the end, it remains a puzzle.
The economists find this worrying. In a large and complex country like India, they warn, this could "easily lead to social disharmony as populous, poorer regions attempt to extract greater redistribution from less populous, richer regions - whether within or across states".
Dr Dehejia feels it would be a good idea for the government to use night lights as a proxy to measure economic activity in India. "We have a paucity of good data in India. And no single data set is a silver bullet," he says.
What ails the Indian economy?
And anyway, proxies have been used for long to measure growth. The US central bank has used electricity consumed as an indicator of economic activity. One economist estimated national income for Habsburg successor states by relating GDP per capita to letters mailed per person, among other things. Economists have even used skeletal remains to measure standard and inequality in the US.
Night lights pose their own challenges. One is accounting for the phases of the moon, which constantly varies the amount of light shining on earth. Then there's atmospheric effects due to aerosols, water vapour and ozone, and extraneous light sources such as solar illumination. But the latest sensors on satellites have been yielding richer spatial details like detecting lit roads and dimly lit sources. Scientists have been developing new software and algorithms to make night lights imagery clearer, more accurate and readily available.
Over time researchers have used night lights captured from space to find out how cities expand, and track land-use changes. They have monitored light intensity to estimate use of energy during festive seasons. Night lights have been used to track conditions in conflict-affected areas, and help in disaster response. They have have helped explain seasonal fluctuations in infectious diseases, mapped carbon emissions and light pollution, among other things.
"In other words," says Bhartendu Pandey of Yale University who works on the subject, "night lights observed from more than 800km (497 miles) above the surface of the earth tell us a story about human activities and dynamism that no other data source does."
No Comments For This Post, Be first to write a Comment.
Most viewed from International
Most viewed from World
AIMIM News
Latest Urdu News
Most Viewed
May 26, 2020
Do you think Canada-India relations will improve under New PM Mark Carney?
Latest Videos View All
Like Us
Home
About Us
Advertise With Us
All Polls
Epaper Archives
Privacy Policy
Contact Us
Download Etemaad App
© 2025 Etemaad Daily News, All Rights Reserved.



.jpg)
.jpg)
